Figure 3.
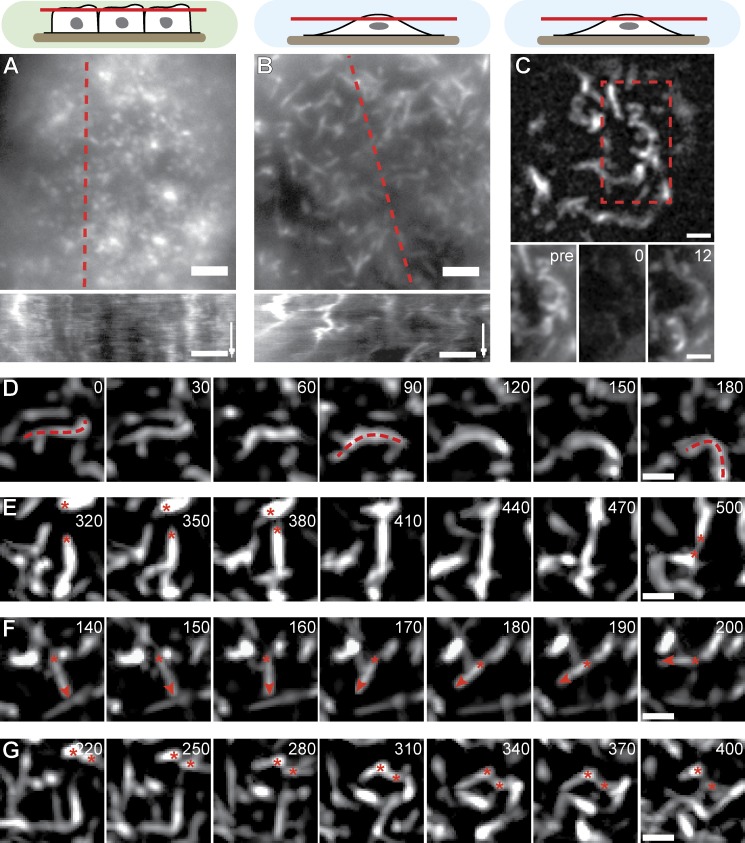
MV dynamics. (A and B) Qualitative motion analysis of MDCK cells stably transfected with Lifeact-GFP. Kymographs along the dotted red lines reveal lateral actin rearrangement specifically in nonconfluent cells (time arrows, 300 s; Videos 1 and 2). (C) Rapid turnover of actin-GFP shown by FRAP. Red dotted box is magnified on the bottom. Pre, time before FRAP event. (D–G) Image series demonstrating typical MV reorganization through bending (D), exchange of connectivity (E), pivoting (F), and lateral translation (G). Red dotted lines, asterisks, and arrowheads indicate MV contours and ends for the respective behaviors. Also see Video 3. Bars: (A–C) 2 µm; (D–G) 1 µm. Times are given in seconds.

