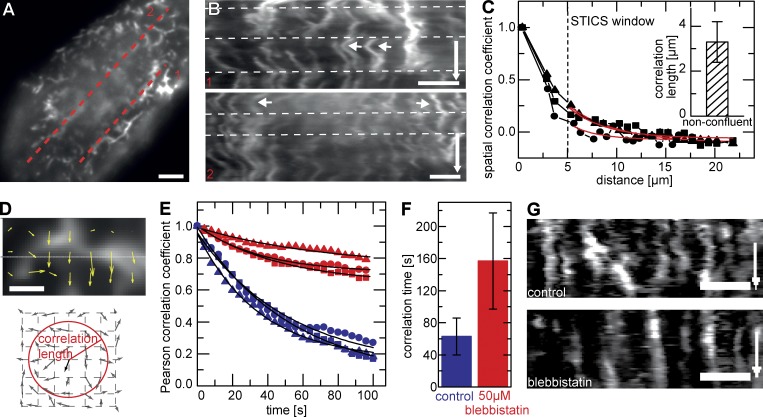
Figure 4.
Myosin-dependent motion of apical actin. (A and B) Kymographs along dotted lines in A reveal coordinated motion of MV (B). Arrows indicate correlated motion of neighboring MV (B, 1) and noncorrelated motion of distant MV (B, 2). Time arrows, 500 s. White dotted lines represent viewing guides to better follow trace evolutions. (C) STICS correlation analysis with characteristic spatiotemporal correlation length (inset: 3.3 ± 0.9 µm [mean ± SD]; n = 11). Red lines represent exponential fits. (D) Calculated STICS flow field represented by velocity vectors on a uniform grid. Schematic indicates velocity vectors and correlation length outlined by a radial gradient circle. Arrows indicate direction and magnitude of flow vectors. (E and F) Effect of inhibition of myosin II activity on correlation time in actin reorganization. Sample curves (E) and mean Pearson correlation coefficients (F) are shown for control cells (blue, 62 ± 20 s [mean ± SEM]; n = 8) and cells treated with 50 µM blebbistatin (red, 156 ± 60 s [mean ± SEM]; n = 12). Black lines represent exponential fits. (G) Kymographs from cells analyzed in E and F showing that inhibition of myosin II blocks lateral reorganization. Time arrows, 300 s. Squares, triangles, and circles indicate data points for three representative cells. Bars: (A, B, and G) 2 µm; (D) 1 µm.

