Figure 5.
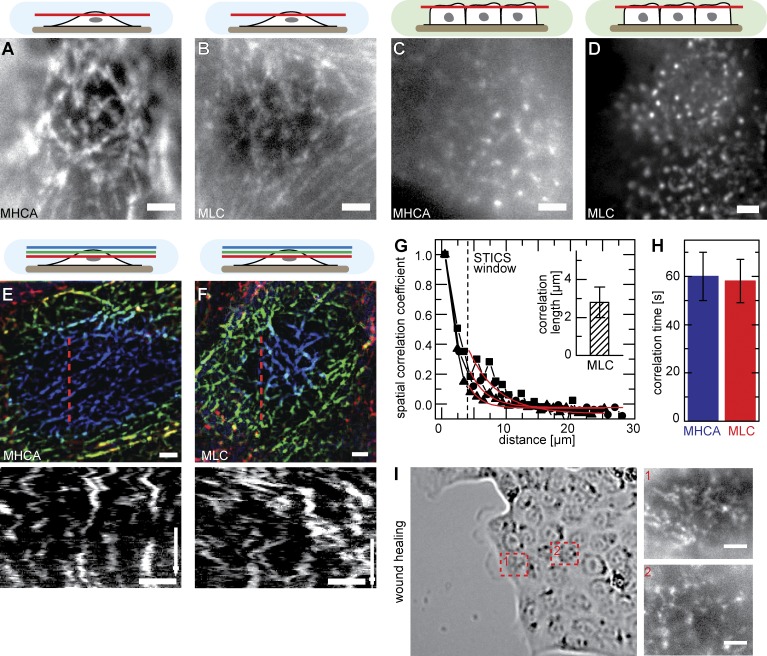
The apical myosin II network. (A–D) Apical organization of myosin II filaments visualized by labeling of myosin heavy chain II A (MHCA; A and C) or myosin light chain (MLC; B and D) with GFP. Whereas confluent cells exhibit punctate myosin II signals (C and D), nonconfluent MDCK cells form isotropic networks of myosin at their apical cell surface (A and B). (E and F) Dynamic rearrangement of myosin networks labeled with MHCA-GFP (E) or MLC-GFP (F) labeled (time arrow, 400 s; Video 4). Kymographs were taken along the indicated red dotted lines. (G) Representative STICS curve of MLC-GFP dynamics and characteristic correlation length (inset, 2.8 ± 0.8 µm [mean ± SD]; n = 8). Red lines represent exponential fits. (H) Correlation times for myosin network mobility (60 ± 10 s [means ± SEM]; n = 14 [MHCA] and 9 [MLC]). (I) Apical myosin organization in wound-healing experiments. Examples are shown for an isotropic myosin network in a cell close to the wound (1) and more punctate signal of myosin in a cell within the sheet (2). Bars, 2 µm.

