Figure 6.
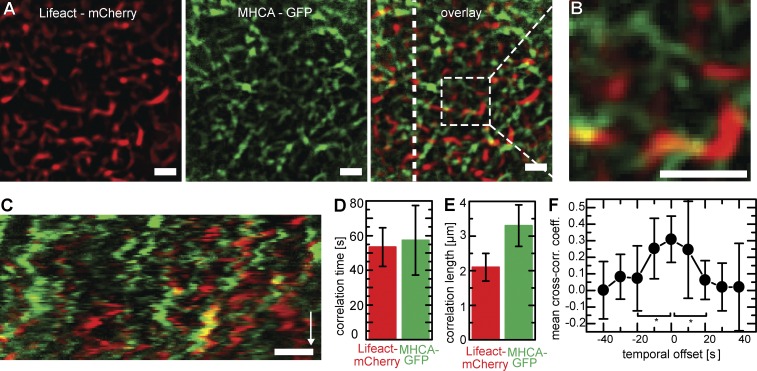
The apical actomyosin network. (A–C) Localization and dynamics of actin and myosin in MDCK cells stably transfected with Lifeact-mCherry and MHCA-GFP (Video 5). Both markers label distinct regions (A) that only rarely overlap (yellow in B). A kymograph (C) along the dotted line (overlay) shows correlated motion patterns for both structures. Bars, 2 µm. Time arrow, 400 s. (D and E) Correlation analysis showing similar temporal (D; actin: 53 ± 11 s; myosin: 57 ± 20 s [means ± SD]; n = 10) and spatial (E; actin: 2.1 ± 0.4 µm; myosin: 3.3 ± 0.6 µm [means ± SD]; n = 7) correlation of actin and myosin structures within the same cells. (F) Cross-correlation analysis of STICS velocity. The fact that the mean cross-correlation coefficient (cross-corr. coeff.) peaks at Δt = 0 s indicates interdependence of actin and myosin motion (n = 8; SDs). *, P < 0.05.

