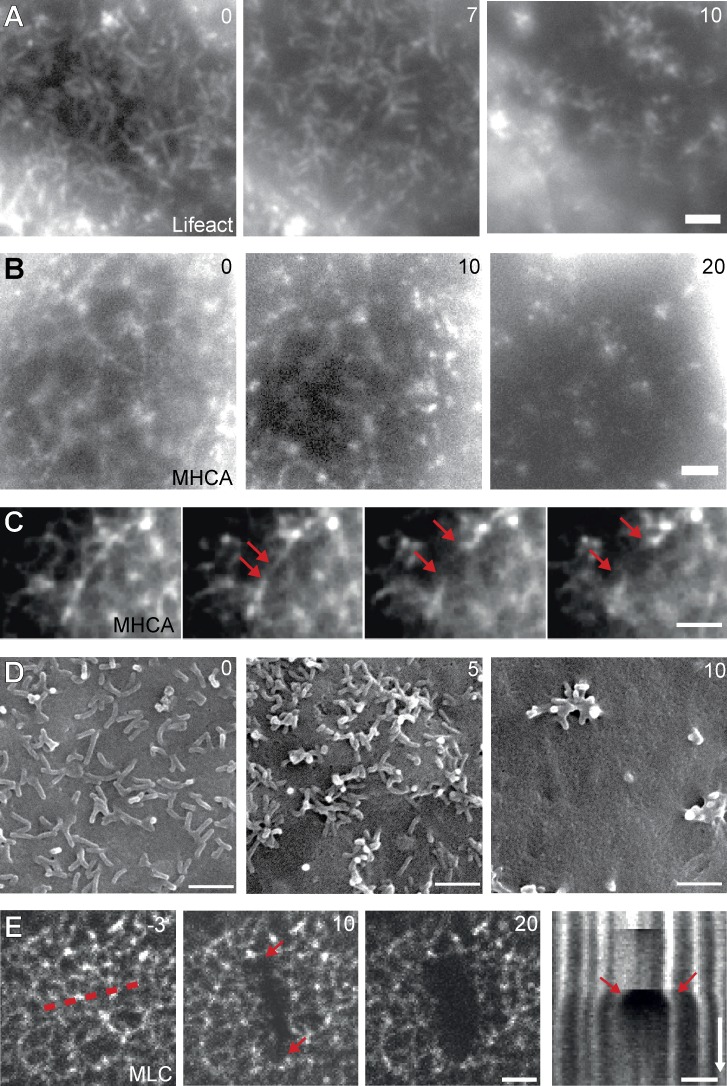
Figure 7.
Perturbation of network organization. (A–C) Changes in actin (A) and myosin (B and C) organization upon treatment with 2 µM latrunculin A (Video 6). Rupture of networks (C) and formation of clusters (A and B) are shown in selected cells over time. Arrows indicate ends of rupturing myosin filament. (D) Visualization of MV clustering with SEM. (E) Recoil of myosin filaments after scission by laser ablation demonstrates that the apical actomyosin network is under tension. Release of tension appears as the extended gap (arrows) in the kymograph (drawn along dotted line). Bars, 2 µm. Time arrow, 25 s. Times are in minutes (A, B, and D) or seconds (E).

