Figure 8.
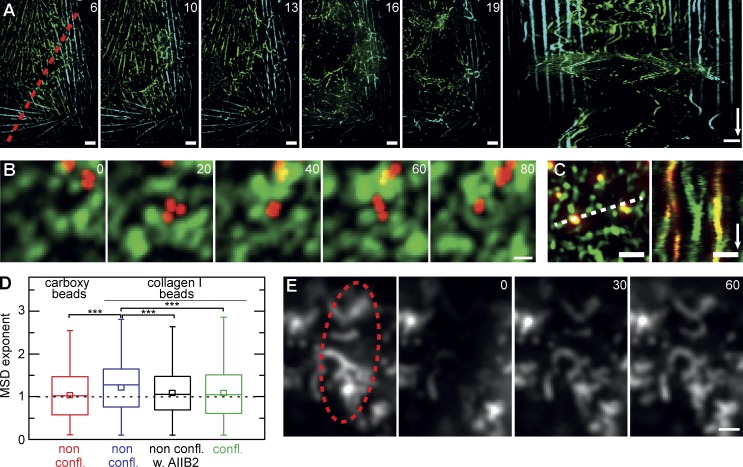
Network connectivity and plasma membrane organization. (A) Destabilization of the apical actomyosin network in the presence of low concentrations of 500 nM latrunculin B. Drug treatment induces large-scale reorganization of apical myosin involving the coordinated motion of whole sections of the network (Video 7), whereas basal stress fibers remain unaffected (green: projection of apical 5 µm; cyan: basal focal plane). The kymograph was taken along the indicated red dotted line. (B) Mobility of fluorescent carboxylated beads (red) on the apical cell surface (green: Lifeact-GFP; maximum projection of five subsequent frames at 1 frame/s). (C) Collagen I–coated beads bind to MV and are guided by their motion (kymograph along dotted line). (D) MSD analysis reveals active transport (exponent > 1) of collagen I–coated beads attached to nonconfluent cells (non confl.; 11 cells, n = 426). In contrast, free diffusion (exponent = 1) is seen for carboxylated beads (7 cells, n = 422) and collagen I–coated beads on either nonconfluent cells treated with the integrin β1 inhibitory antibody AIIB2 (5 cells, n = 410) or confluent cells (confl.; 5 cells, n = 668). Beads in B–D had a 100-nm diameter. Results are given as box plots marking 25–75 percentile (boxes), median (lines), and mean value (small boxes). Whiskers indicate range of data points. ***, P < 0.001. (E) α5 Integrin–GFP is concentrated in actin-rich MV but shows rapid exchange, as demonstrated by FRAP analysis (bleached region is shown by the dotted ellipse). Bars: (A and E) 2 µm; (B and C) 1 µm. Time arrows: (A) 300 s; (C) 50 s. Time stamps are in minutes (A) and seconds (B and E).

