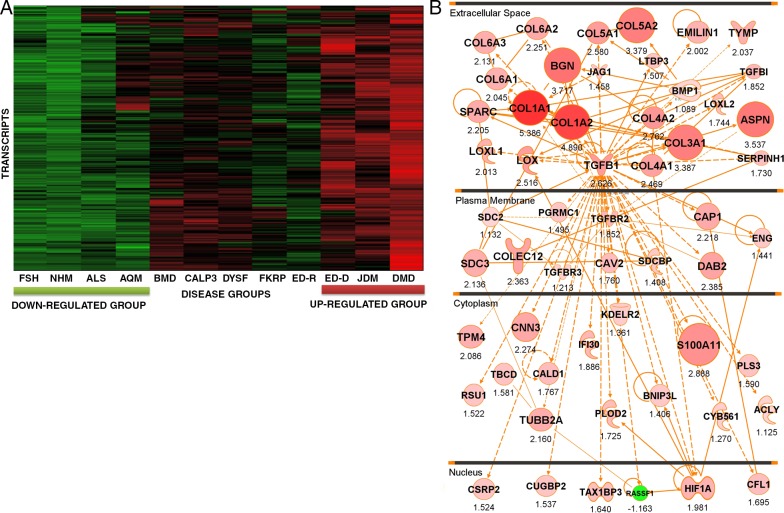
Figure 1.
An iterative composite scoring bioinformatics approach identifies a transcript network associated with progressive muscular dystrophy. (A) Shown is a heat map of 117 muscle biopsies grouped by diagnostic category. The individual transcripts (y axis) defining this disease clustering were used to generate the molecular network in B. Disorders studied were facioscapulohumeral muscular dystrophy (FSH), normal human skeletal muscle (NHM), amyotrophic lateral sclerosis (ALS), acute quadriplegic myopathy (AQM), Becker muscular dystrophy (BMD), LGMD2A (CALP3), LGMD2B (DYSF), LGMD2I (FKRP), Emery–Dreifuss muscular dystrophy X-linked (EMRN [emerin]), Emery–Dreifuss muscular dystrophy autosomal dominant (ED-D; LMNA mutations), juvenile dermatomyositis (JDM), and Duchenne muscular dystrophy (DMD). (B) Shown is the integration of component mRNAs from the clustering in A into functional relationships based upon the literature (IPA). The top-ranked Ingenuity networks were merged into a 56-transcript network. This network is seen to be centered on TGF-β and fibrosis (collagens and other extracellular matrix transcripts), and the network is visualized based on the typical subcellular localization of the encoded proteins of each transcript. Red symbols represent up-regulated transcripts, with the size of the symbol and intensity of color scaled to the observed fold change between groups (DMD, JDM, and ED-D vs. FSH, ALS, and NHM), with fold change with the PLIER algorithm provided under each symbol. Statistical data corresponding to this network are provided in Table 1.

