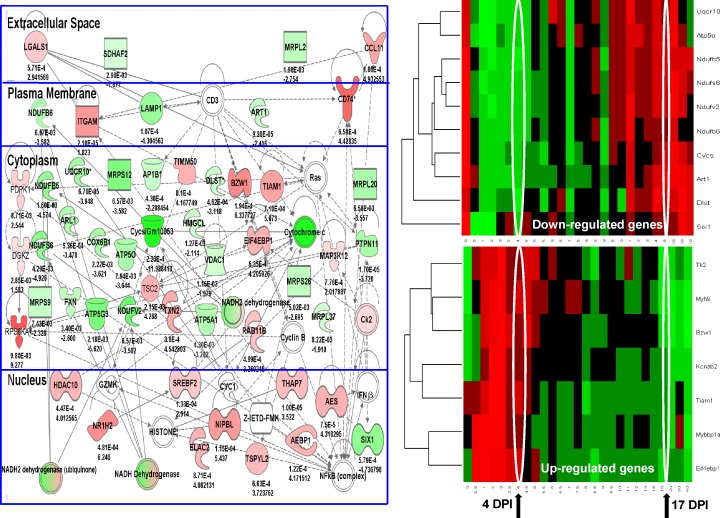
Figure 4.
Muscle tissue areas located between asynchronous injuries spaced 4 d apart show chronic inflammation and loss of mitochondrial transcripts. LCM was used to isolate regions of myofibers in between injury sites (cross talk area) spaced 4 d apart, with muscles studied 13 d after the second injection when myofiber regeneration was expected to be largely complete. Shown is the top-ranked Ingenuity network (left) reflective of chronic inflammation (red gene/protein symbols), and loss of mitochondrial components (green symbols). This network was then superimposed on normal murine regeneration time series (right), separated by the mitochondrial-related transcripts (down-regulated genes; top right) and inflammatory transcripts (up-regulated genes; bottom right). The mice that were sacrificed after regeneration should be largely complete (17 d postinjection [DPI]). However, the myofibers between the two injury sites showed expression patterns that were more consistent with the 4-d time point (4 d postinjection). Statistical analyses associated with the heat map are provided in Table 4. These data suggest that the myofibers in between the two injury sites are suspended in a time period of regeneration, defined by the days between the two sequential injuries (cross talk microenvironment). Numbers indicate p-value (top) and fold change (bottom).

