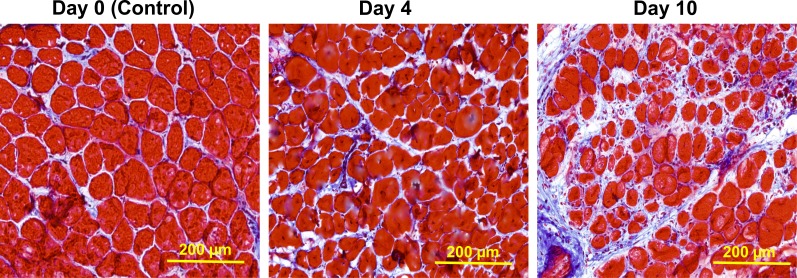
Figure 6.
Histological analysis of connective tissue proliferation (fibrosis). Shown is Masson’s modified trichrome staining of cryosections in the area of muscle between injection sites staged 0, 4, and 10 d apart (n = 3 muscles per group). Endomysial fibrosis is most evident in the area between injections space 10 d apart, consistent with the LCM expression profiling data (Fig. 4 B).

