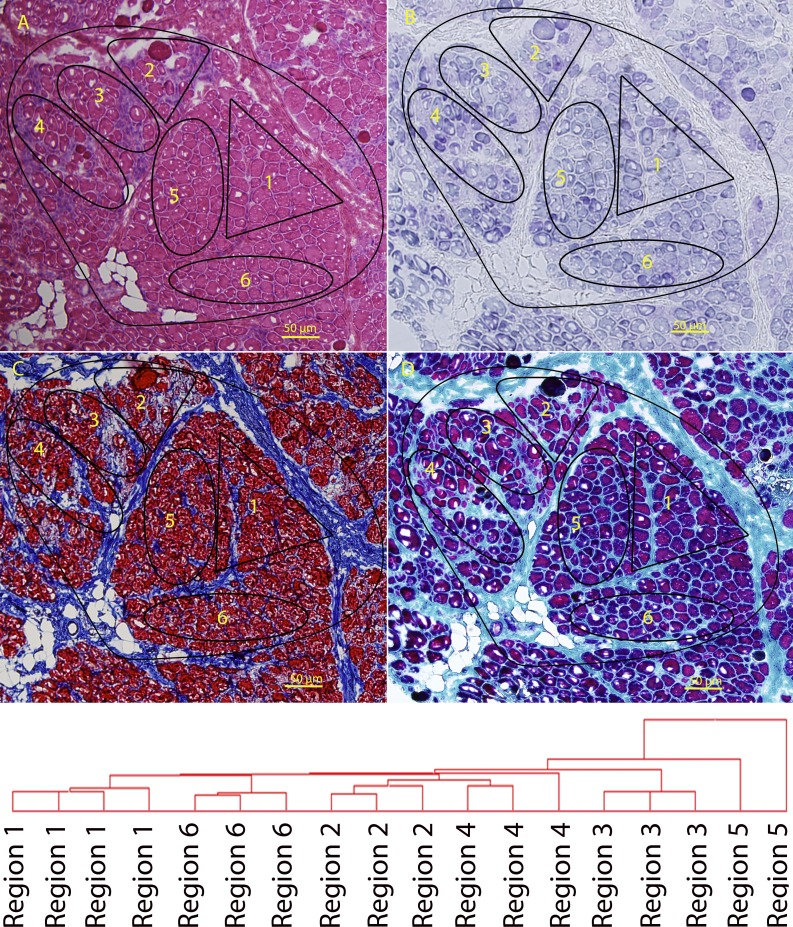
Figure 9.
LCM of regions of a muscle biopsy from a DMD patient. (A–D) A frozen muscle biopsy from a 3-yr-old DMD patient was stained for hematoxylin and eosin (A), mitochondrial enzyme activity (SDH; B), Masson’s modified trichrome (C), and Gomori’s modified trichrome (D). Variable states of degeneration and regeneration can be seen within each fascicle. The different regions indicated (1–6) were isolated by LCM, and individual regions (n ≥ 3 per region) were analyzed by mRNA profiling. The areas were chosen based on visual histopathology, where both fascicles and relatively distinct histological subareas within the fascicles were chosen. Microarray data from replicates of LCM regions microdissected from adjacent cryosections was subjected to unsupervised chip-based clustering. This showed replicates to cluster closely in the dendrogram. This represents heterogeneity within fascicles in DMD muscle, as hypothesized by the asynchronous regeneration model described in the accompanying text.

