Figure 5.
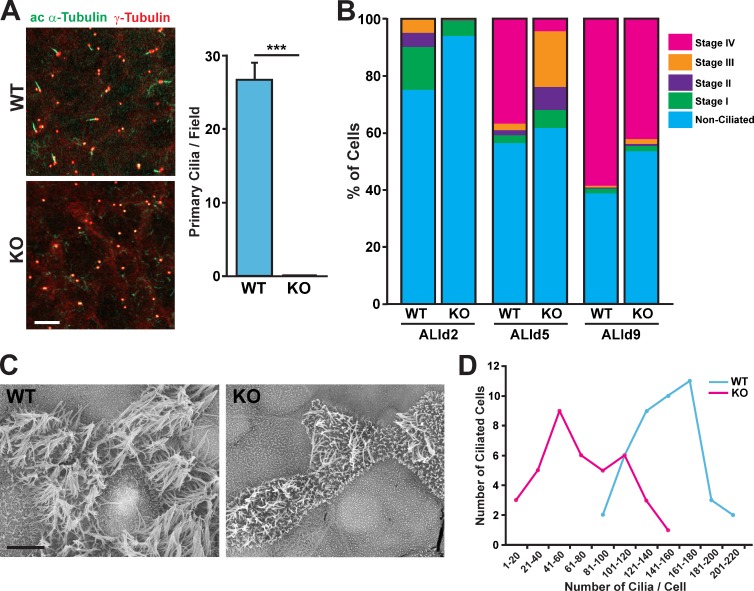
Impaired ciliogenesis in CbyKO ciliated cells. (A) WT and CbyKO MTECs were colabeled at ALId2 with acetylated (ac) α-tubulin and γ-tubulin antibodies. Bar, 10 µm. The quantification of primary cilia is shown in the graph on the right. For each genotype, primary cilia were counted in three microscopic fields (100× magnification) per MTEC preparation, and data are presented as means ± SEM from three independent MTEC preparations. ***, P < 0.001. (B) WT and CbyKO MTECs were fixed at ALId2, d5, and d9, and the percentage of cells in each stage of ciliogenesis were quantified based on immunostaining for acetylated α-tubulin and γ-tubulin. At least 600 cells/genotype/ALI day were counted from three independent MTEC preparations. See also Fig. S4. (C) Representative SEM images of WT and CbyKO ciliated cells in MTEC cultures at ALId9. Numerous short microvilli are apparent on the apical surface of CbyKO ciliated cells. Bar, 5 µm. (D) The number of cilia on ciliated cells was quantified on SEM images of MTEC cultures at ALId9, and the distribution of ciliated cells with numbers of cilia per cell was grouped into bins of 20. WT, n = 43; KO, n = 39.

