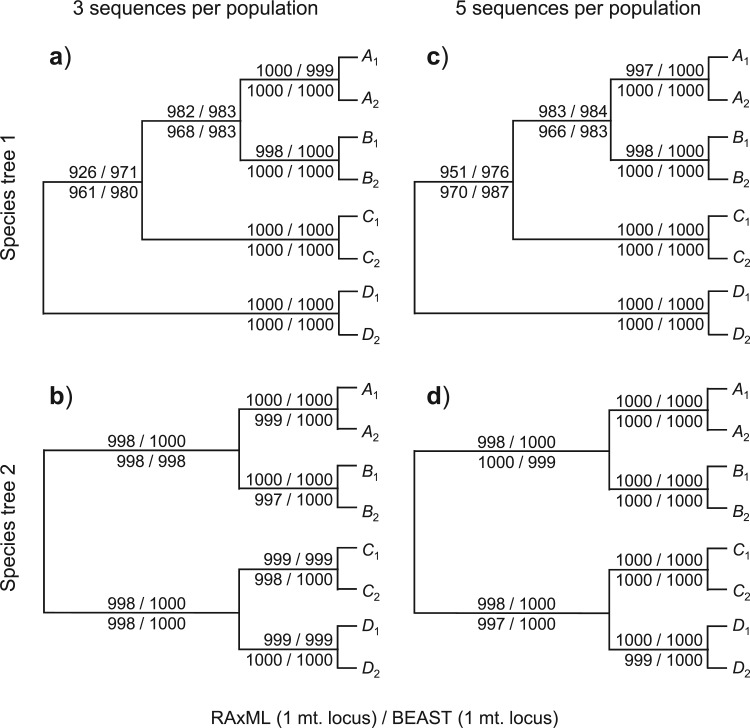
Figure 3.
Frequency (out of 1000 replicates) at which each clade in the correct population (guide) tree is recovered by RAxML and beast in the analysis of the mitochondrial locus. The numbers above the branch are for the low-mutation rate whereas those below the branch are for the high rate. See legend to Figure 2.

