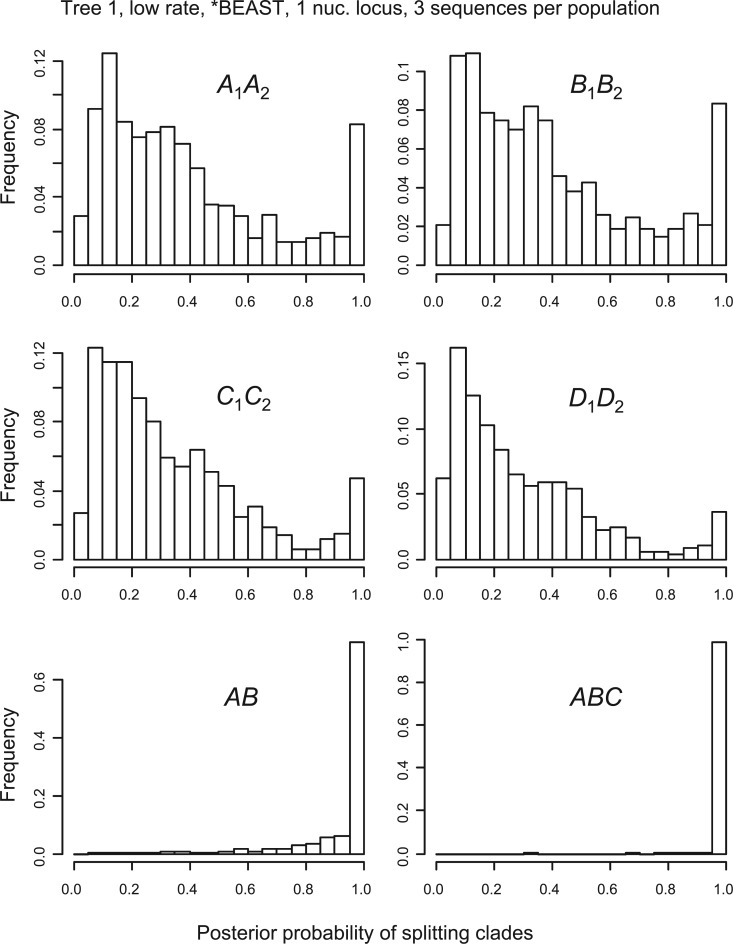
Figure 4.
Histogram of posterior probabilities for splitting clades into different species by bpp in data of one locus, with three sequences sampled from each population at the locus, simulated using tree 1 at the low-mutation rate, when the guide tree was inferred using *beast. Each bin is of size 0.05. The frequencies in the last bin for splitting clades , and are the false-positive rates listed in Table 2.

