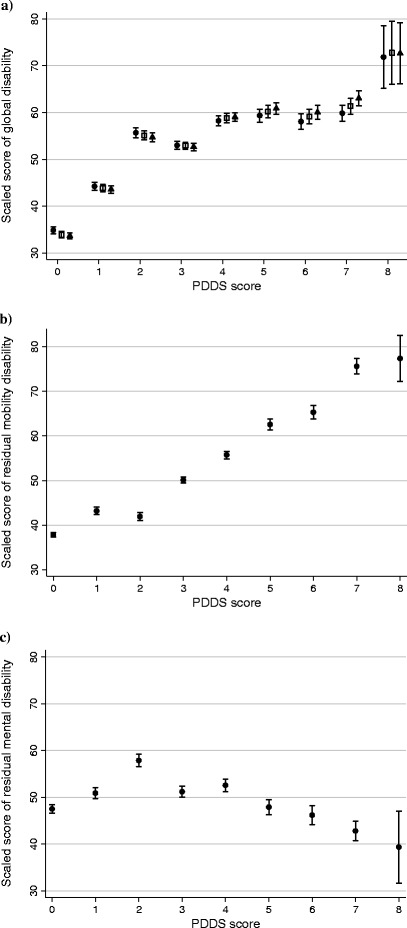
Figure 5.

Associations between Performance Scales-based, IRT-derived, scores of disability and PDDS scores in a sample of NARCOMS registrants. a) Scores of global disability generated from the bifactor IRT model (●) versus the unidimensional IRT model (□, pattern scores; ▲, summed scores). b) Scores of residual physical disability generated from the bifactor IRT model. c) Scores of residual mental disability generated from the bifactor IRT model. Note: Although the scores of global disability, residual physical disability, and residual mental disability are all reported as scaled scores (Mean, 50; SD, 15), they are not on the same metric. Error bars represent 95% confidence intervals. Spearman correlations between IRT scores and PDDS scores: Figure 5a) ● 0.60, □ 0.65, ▲0.68; Figure 5b) 0.72; Figure 5c) 0.07.
