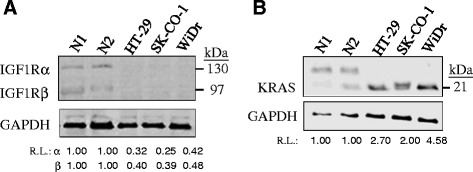
Figure 4.

IGF1R (A) and KRAS (B) protein levels in colon cancer cells. In the western blot analysis, three colon cancer cell lines, WiDr, SK-CO-1 and HT-29 and two normal colon tissues, N1 and N2, were used. R.L., relative levels after normalizing to 1.00 in the normal samples. In KRAS, the nature of the upper spurious band was unknown. R.L. of KRAS was calculated by taking the mean intensity of the two normal bands as 1.00.
