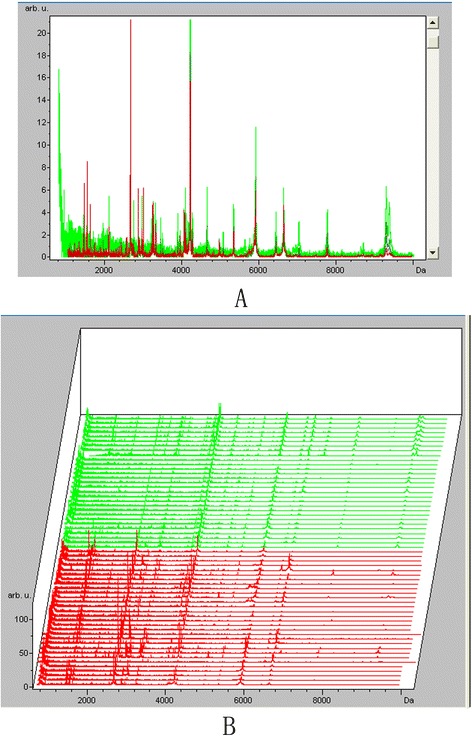
Figure 1.

Serum peptide fingerprints and cluster analysis of newly diagnosed ALL and healthy control. A. Comparison of serum peptide fingerprints between ALL patients and healthy controls showed that peak number and intensity of the two groups were completely different. B. Stack view of comparison between ALL patients and healthy controls. (Red: ALL newly diagnosed group Green: Healthy control group).
