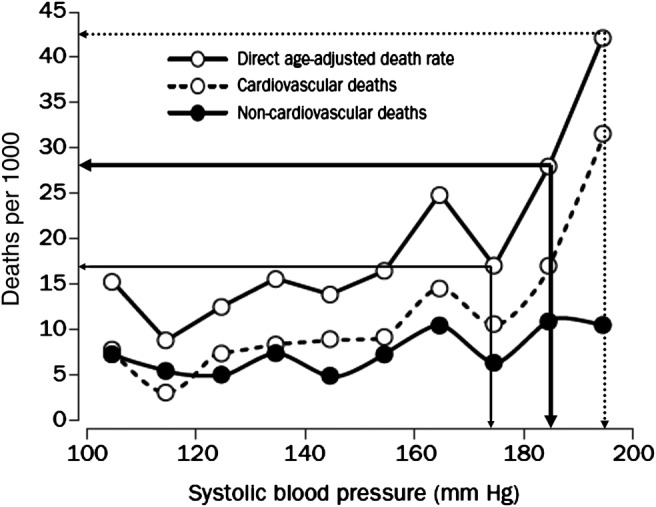
Figure 1.

Actual age-adjusted rates for men aged 45–74 years related to systolic blood pressure (based on age-specific rates in Framingham study). The direct age-adjusted rate is the sum of the lower two curves (taken from Ref.16 while the horizontal and vertical straight lines have been added by the author).
