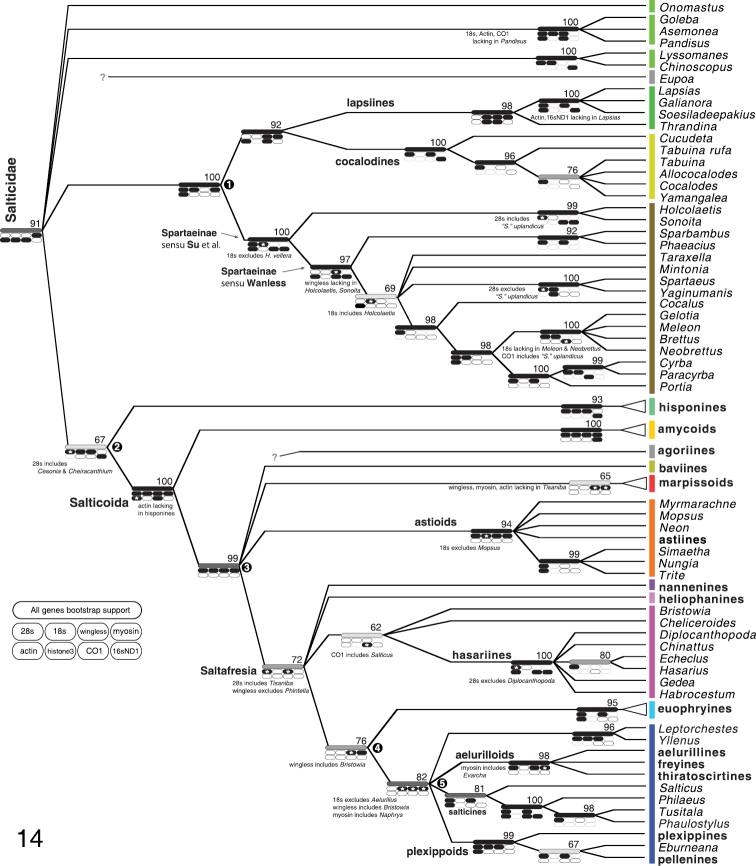
Figure 14.
Summary of phylogenetic results. Number above branch shows percentage of maximum likelihood bootstrap replicates with clade. For clades outside the Salticoida, these percentages come from the Non-salticoid dataset with 1500 replicates; within the Salticoida, these come from the Salticoida dataset with 1000 replicates; the Salticoida percentage comes from the Complete dataset with 1000 replicates. Long bar on branch shows same percentage graphically: black 91–100%; dark gray 81–90%; gray 71–80%; light gray 51–70%. Oval spots show presence of clade in maximum likelihood tree for individual genes, with exceptions noted by * and adjacent notes. The notes about wingless on the Spartaeinae node and actin on the Salticoida node are ambiguous in placement; they could equally well have been placed one node deeper because of missing data. Pale gray outline indicates no conclusion because of inadequate taxon sampling. All indications of support are from analyses excluding Eupoa, agoriines, Spartaeus spinimanus and “Spartaeus” uplandicus. Bars show colors used to highlight taxa in Figs 15–27.

