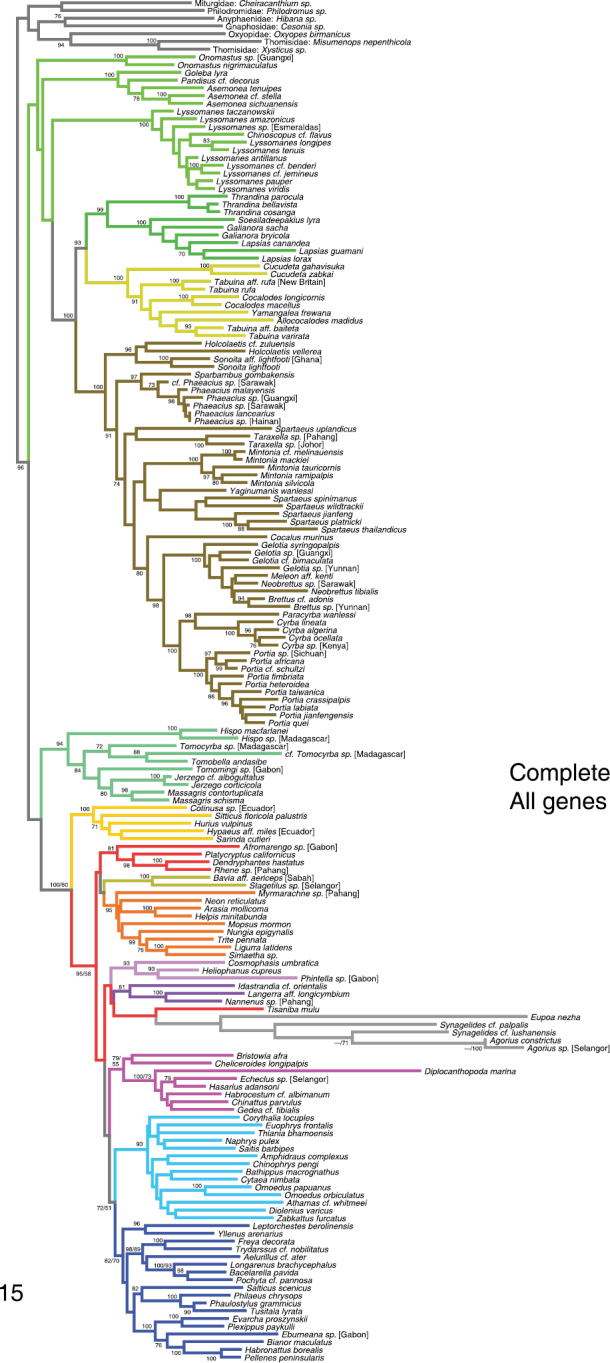
Figure 15.

Phylogeny from complete taxon sample, All Genes analysis. Numbers beside branches show percentage of 1000 RAxML likelihood bootstrap replicates with clade in analysis with Eupoa and agoriines excluded. In analyses with these taxa included (500 bootstrap replicates), bootstrap percentages are within 5 of those shown, except for branches with two values (e.g. “100/60”), in which case the first value is from an analysis with Eupoa and agoriines excluded, the second value with them included. Colors of branches are the same as those highlighting taxa in Fig. 14.
