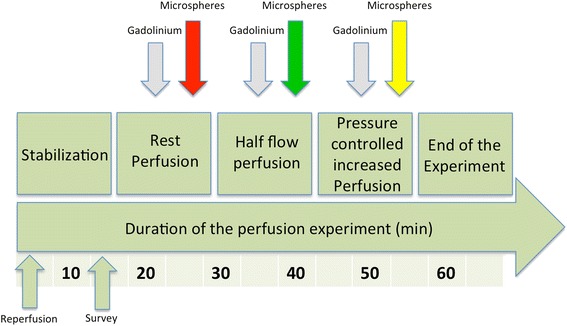
Figure 1.

Time-course of the CMR examination. After preparation stability was achieved, CMR imaging was started with the acquisition of rest perfusion images. This process was repeated with a 50% flow reduction and during pharmacological vasodilation with adenosine with coronary perfusion pressure controlled increase in MBF. Microspheres were injected after each gadolinium injection with a different colour for each perfusion scan. Please note that the order of the changes made to the flow and the respective colour of injected microspheres were randomized.
