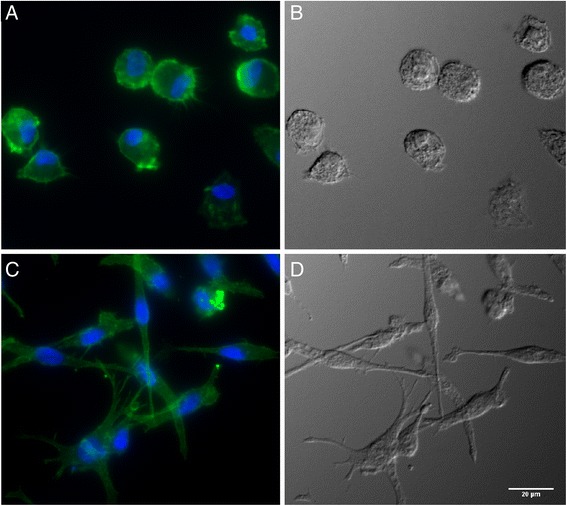
Figure 1.

Cell morphology after differentiation of peripheral blood monocytes. Fluorescence microscopy and DIC was used to visualize differences in cell morphology. A and B, MoMΦ, C and D, MoDC. A and C, fluorescence microscopy with nuclei stained in blue with DAPI and cytoskeleton stained in green with phalloidin. B and D, DIC.
