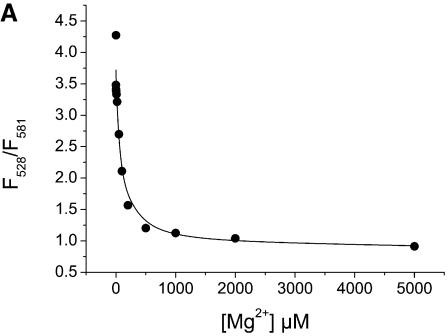
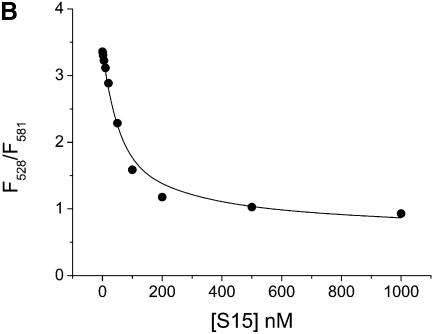
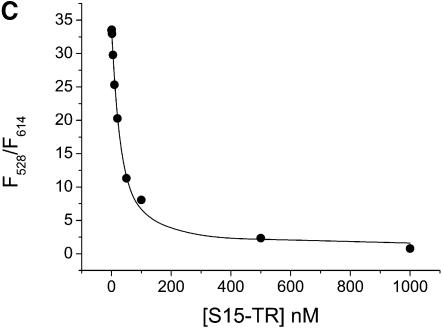
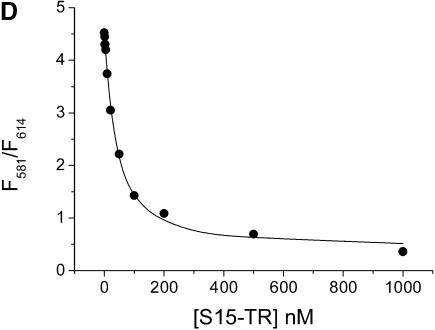
Figure 2.
Mg2+ and S15 titrations. (A and B) Titration of the Fl/TMR 3WJ (20 nM) with Mg2+ and S15. Folding of the junction is monitored via the ratio of Fl/TMR emission intensities. (C and D) Titration of the Fl and Fl/TMR 3WJ with S15-TR. S15-TR binding is followed via the ratio of TMR/TR emission intensities. Non-linear least-squares analysis yields Kd values of 77 µM (Mg2+ binding) and 50 nM (S15 binding). The binding of S15-TR to the fluorescently labeled junction is characterized by Kd values of 17 nM (Fl junction) and 27 nM (Fl/TMR junction), confirming that the system is not compromised by fluorophore attachment.


