
Figure 4.
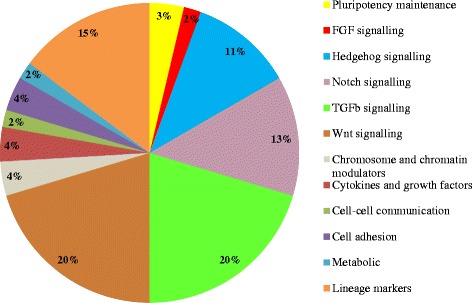
SP subpopulation enriches for cells expressing stem-cell related genes. Combined data from Stem Cell PCR Array and Stem Cell Signaling PCR Array were clustered according to gene function or signaling pathways. Gene expression data were normalized to five housekeeping genes via geometric mean calculation. Only genes which were significantly upregulated by at least 2 fold, with raw Ct values of less than 35 are shown here. None of the downregulated genes fulfilled the selection criteria of at least 2 fold change and p < 0.05. Some of the genes appeared in more than 1 gene function or signaling pathway (refer to Additional file 2 for details).