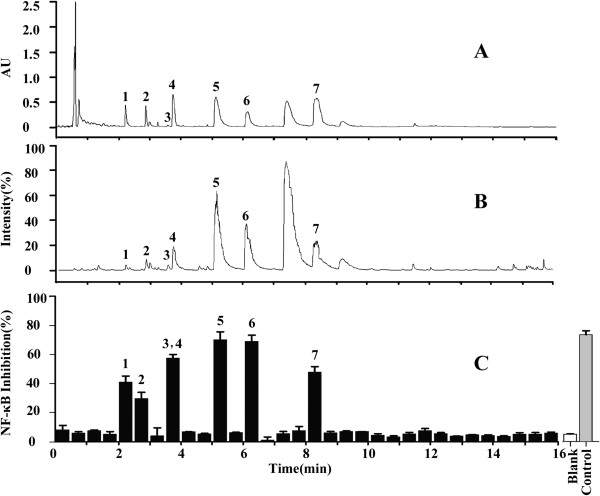
Figure 3.

UPLC/Q-TOF MS and bioactivity analysis of the BUE of RM. (A) UPLC/UV chromatograms of the BUE of RM; (B) TIC chromatogram in the positive ESI mode; and (C) the chromatogram of the NF-κB activity detected via the dual-luciferase reporter assay system to determine NF-κB inhibition. The peak values are consistent with those reported in Table 1.
