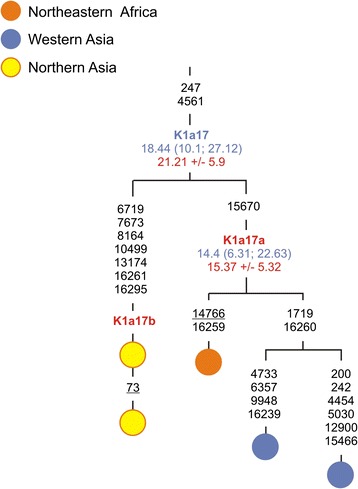
Figure 1.

Phylogenetic tree of haplogroup K1a17. Numbers along links refer to substitutions scored relative to rCRS [47], back mutation is underlined. Time estimates (in kya) shown along links next to clade labels are based on the complete mtDNA genome clock (given with 95% CI and marked in blue) and the coding region clock (given with the associated standard error and marked in red). Redefined haplogroup label is shown in blue; red are newly identified haplogroups in the present study.
