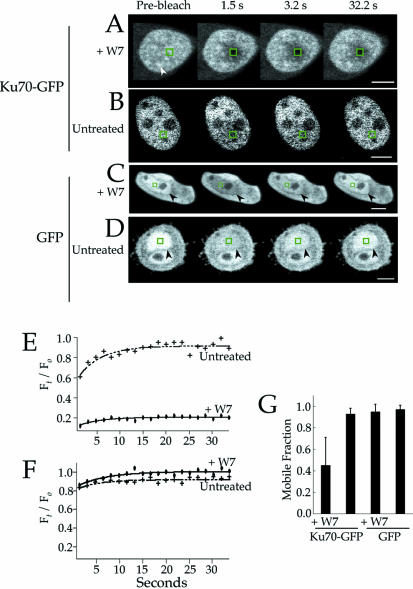
Figure 2.
W7 specifically inhibits the mobility of Ku–GFP. (A–D) FRAP measurements of Ku70–GFP. (A and B) The cells were bleached using a 2 s pulse of laser illumination. The site of bleaching is indicated by the green squares. Each frame was collected at the indicated time post-bleaching. In (A), the sample was pre-treated with 500 µM W7 for 2 h prior to measurement. The white arrowhead in (A) indicates a Ku–GFP-enriched structure that appears reticulated throughout the nucleus. In (B), the sample was untreated before measurement. The white bars represent 5 µm. (C and D) The same as (A) and (B), except the cells expressed GFP. The black arrowheads indicate the boundary of the nucleus. (E) Recovery curves for the FRAP experiments in (A) and (B). The y-axis represents the normalized fluorescence intensity of the bleached region at each time point, and it was calculated as described (18). (F) The same as (E), except representing recovery curves for the experiments in (C) and (D). The mobile fraction from multiple FRAP measurements of Ku–GFP or GFP alone were averaged and plotted (G). Sample sizes were 17 for Ku–GFP in W7-treated cells, and 19 for the sample with Ku70–GFP but with no treatment. The sample sizes for the GFP experiments were 10 and 19 for the W7-treated and untreated samples, respectively.

