Figure 2.

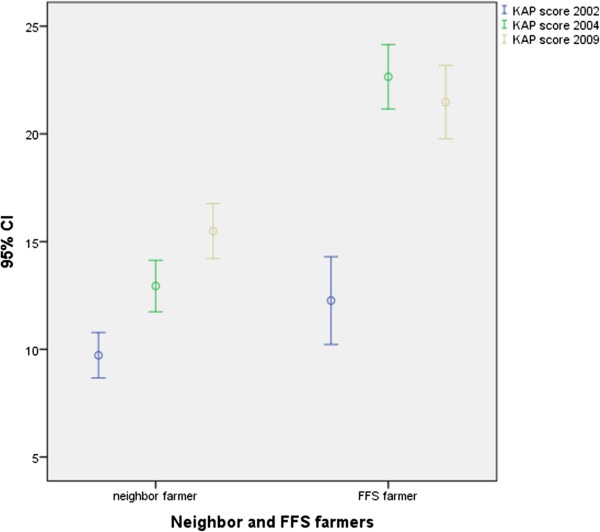
Changes in KAP score of FFS farmers (N = 23) and neighbor farmers (N = 47) from 2002 to 2004 to 2009, mean values with 95% CI, (maximum score = 27).

Changes in KAP score of FFS farmers (N = 23) and neighbor farmers (N = 47) from 2002 to 2004 to 2009, mean values with 95% CI, (maximum score = 27).