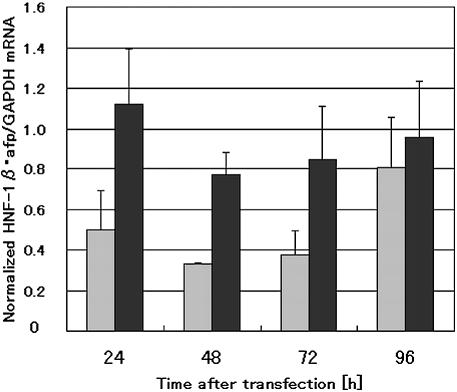
Figure 2.
Time course analysis of HNF-1β and α-fetoprotein mRNA levels after transfection with 1β-1 siRNA. Hepa 1-6 cells were transfected with 100 nM siRNA and harvested for mRNA isolation 24, 48, 72 and 96 h after transfection. The mRNA levels were determined by real-time RT–PCR. Expression levels of HNF-1β and α-fetoprotein were normalized as described in Figure 1. The normalized expression value at the time point of the siRNA addition was then 1.0. The bars represent the averages + SD of the data obtained in three independent experiments Gray bars, HNF-1β; black bars, α-fetoprotein.

