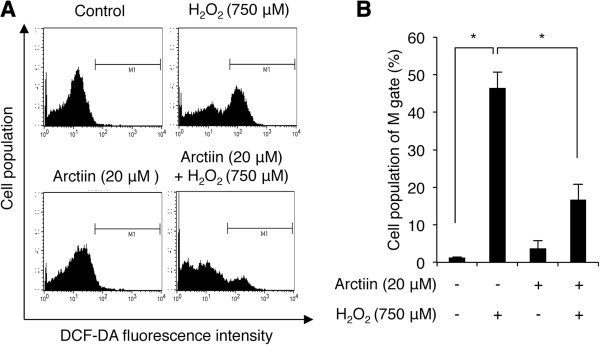
Figure 3.

Analysis of intracellular ROS levels with DCF-DA assays. (A) HHDPCs were pre-treated with DMSO or arctiin (20 μM) followed by H2O2 (750 μM) prior to flow cytometry. (B) The graph indicates the mean value of M1-phase (DCF-DA-stained) cells from three independent experiments. *p < 0.05 compared with H2O2-treated HHDPCs.
