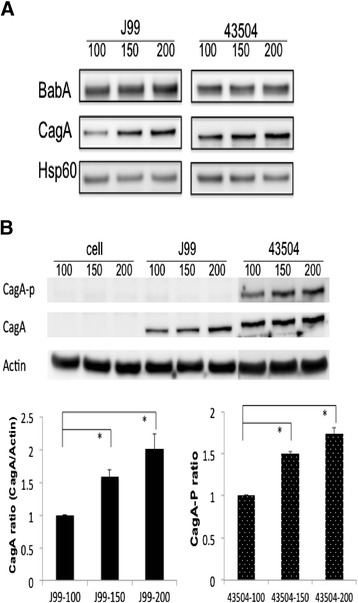
Figure 3.

Figure 3 H. pylori CagA and phosphorylated CagA increased in higher glucose concentration. (A) BabA and CagA expression of H. pylori grown in three glucose concentrations. (B) The level of cell-associated CagA and phosphorylated CagA after H. pylori infecting AGS cells for 4 h. Thee glucose concentrations were 100, 150 and 200 mg/dL, respectively. *indicated a significant difference between the treatment of different glucose concentrations (paired t test, p < 0.05).
