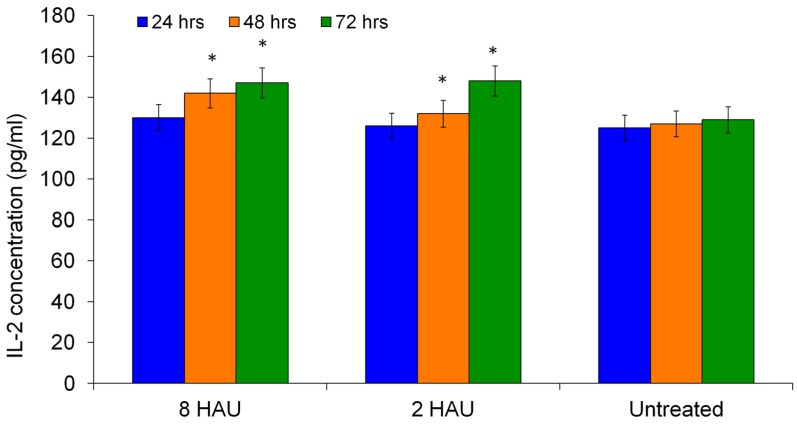
Figure 3.
ELISA result showed the level of interleukin-2 (IL-2) released from the human PBMC after treated by NDV at different titers. The values were the means ± SE of three independent experiment. The differences between the control group and treated group were determined by one-way ANOVA. (* p < 0.05).

