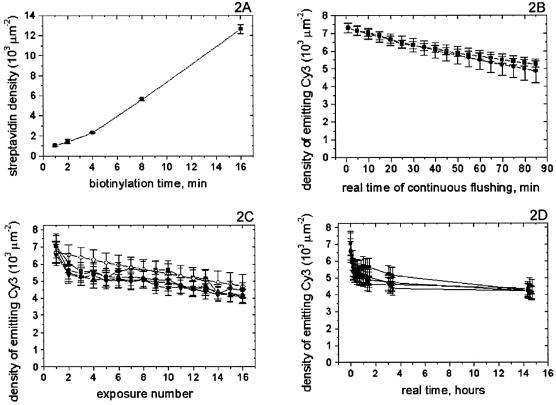
Figure 2.
Chip surface chemistry diagnostics. (A) The chambers of the same device were biotinylated over varying times. Tagged streptavidin saturated the surface sites and measured biotin density. The linear dependence with time is a good tool to tune the DNA surface density as desired. (B) Surface chemistry is stable with prolonged continuous flushing since the signal from anchored tagged DNA (squares) is consistent with the fluorescence bleaching prediction (circles). (C) Signals from tagged DNA anchored in different chambers of the same device (black symbols) are consistent with the bleaching prediction (empty diamonds). The consistency in behavior among chambers shows desired homogeneity of conditions over the array. (D) Same data as in (C) plotted with respect to real time, shows surface chemistry is stable over 14 h at room temperature.

