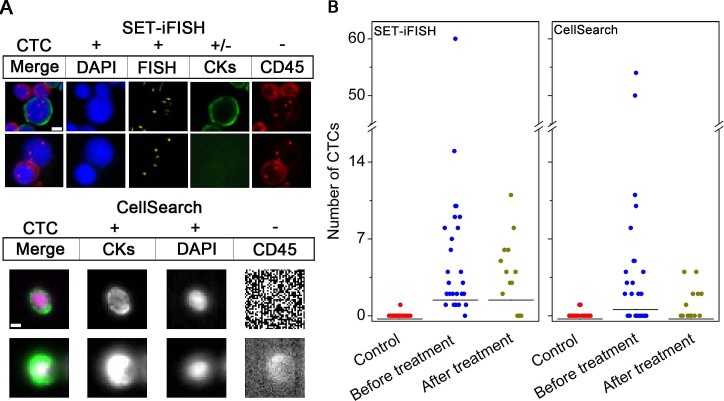
Figure 1. Comparison of CTC enumeration performed by SET-iFISH and CellSearch.
(A) Images of CTCs revealed by SET-iFISH and CellSearch. CTCs identified by SET-iFISH are DAPI+ (blue)/FISH+ (aneuploid chromosome 8, orange)/CKs+ or – (green) and CD45−; CTC identified by CellSearch are CKs+/DAPI+/CD45−. Scale bar = 5 μm. (B) Enumeration of CTCs by SET-iFISH and CellSearch in healthy donors (Control), AGC patients before and after treatment.

