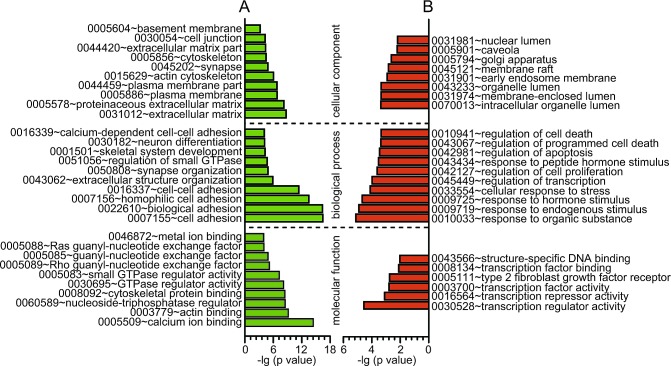
Fig 2. GO analysis of the differentially methylated and expressed genes.
A, GO analysis of differential methylated genes (β > 0.1, P < 0.05). B, GO analysis of differential expressed genes (fold change > 1.5, P < 0.005). X axis, negative logarithm (-lg) of the p value; Y axis, GO category. The top 10 GO terms were shown if there were more than 10 terms.

