
Figure 3.
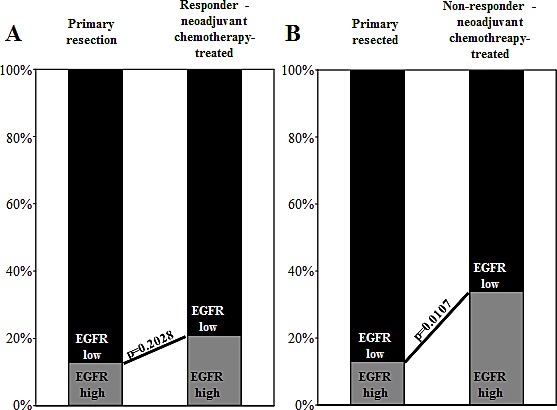
Bar graphs depict EGFR expression level distribution (EGFR-high vs. EGFR-low) in comparisons of primary resection patients with neoadjuvant chemotherapy (A) responders and (B) non-responders. EGFR overexpression is more frequent in non-responding patients, and thus, this overexpression can be interpreted as a factor for chemotherapy resistance.