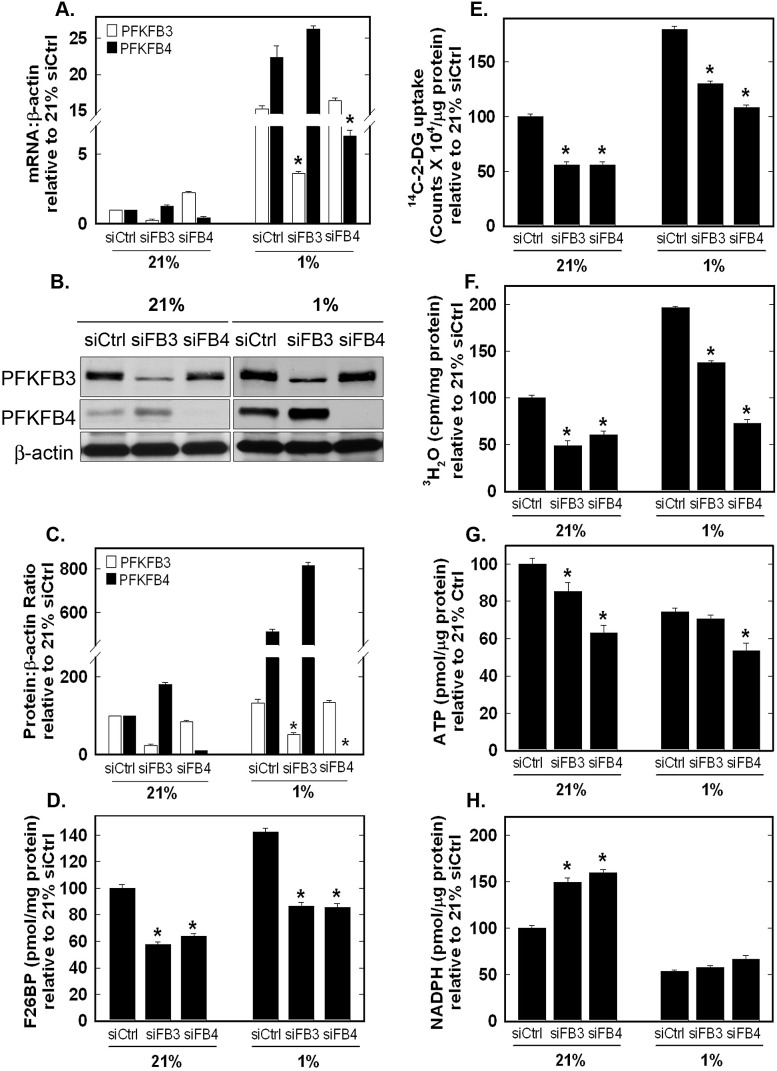
Figure 6. Role of PFKFB3 and PFKFB4 in Hypoxia-Induced F2,6BP production, Glucose Uptake, Glycolysis, ATP and NADPH.
H460 cells were transfected with control siRNA (siCtrl), PFKFB3 siRNA (siFB3) or PFKFB4 siRNA (siFB4), cultured in 21% oxygen or 1% oxygen and examined for PFKFB3 and PFKFB4 mRNA expression (A) and protein expression by Western blot analysis and densitometry (B and C), F2,6BP (D), 14C-2-DG uptake (E), glycolysis (3H2O production from [5-3H]glucose) (F), intracellular ATP (G) and NADPH (H). Data are expressed as the mean ± SD of three experiments. * p value < 0.01 compared to control siRNA.

