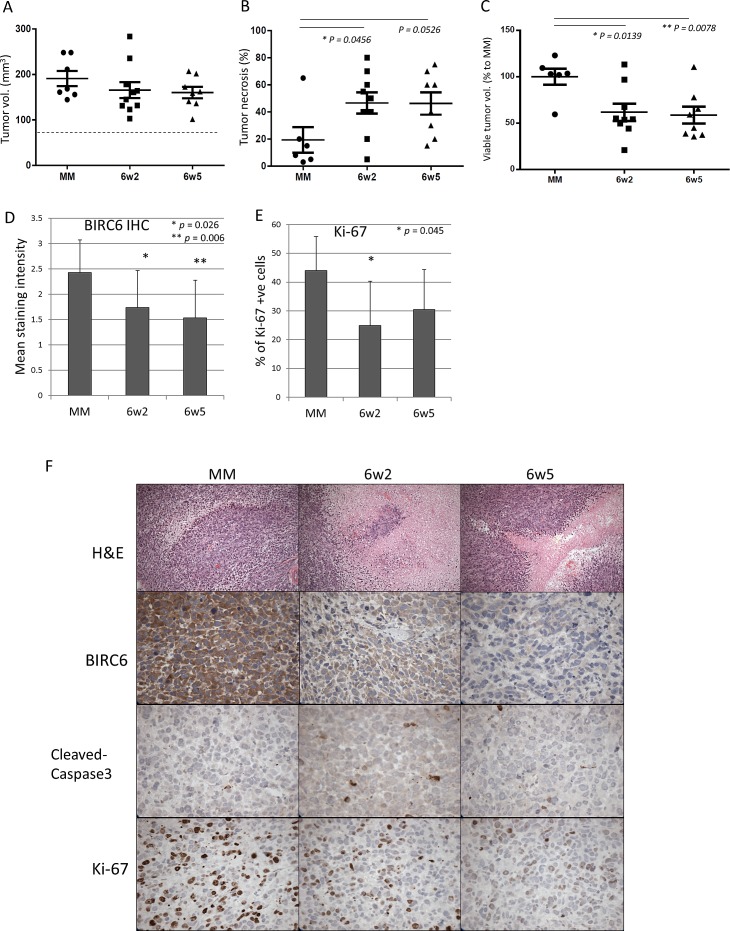
Figure 4. Treatments with dASOs resulted in significant lower viable tumor volume.
(A) Total tumor volumes at the end of treatment (day 15). NOD-SCID mice with established PC-3 subcutaneous xenografts were treated with control, 6w2 and 6w5 dASOs for 15 consecutive days and tumors were harvested at the end of treatment. Dash line refers to mean tumor volumes at day 0 (before treatment, 78 mm3). (B) Percentage of tumor necrosis at harvest determined by H&E staining. (C) Percentage of viable tumour growth from day 0 to day 15 of treatment. Viable tumour volume refers to tumor without necrotic regions (Materials and Methods). Error bars indicate mean ± S.E.M. (D) BIRC6 IHC staining intensity of tumors of control ASO-6w2- and 6w5-treated groups at the end of treatment. (E) Percentage of Ki-67 positive cells as determined by IHC of 6w2- and 6w5-treated tumors at harvest. (F) Representative images of control ASO-6w2- and 6w5-treated PC-3 xenografts using H&E, and IHC staining of BIRC6, cleaved-caspase 3 and Ki-67. 20x magnification.

