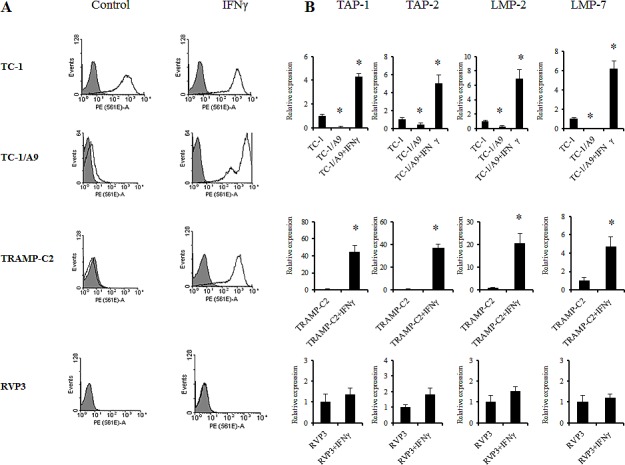
Figure 1. IFNγ upregulation of the cell-surface MHC class I expression cells is associated with APM gene expression in experimental tumour cells.

MHC class I expression (H-2Db and H-2Kb together) was determined by the FACS analysis of control tumour cells and after the treatment with IFNγ. Representative results are presented. (A) Upregulation of APM genes in TC-1/A9 and TRAMP-C2 tumours after treatment with IFNγ. (B) Expression levels of selected APM genes in TC-1/A9 and TRAMP-C2 control tumour cells and after the treatment with IFNγ. As a negative control, MHC class I-deficient RVP-3 cell line that did not respond to the IFNγ treatment was used. TC-1 cells, a MHC class I-positive parental cell line to the TC-1/A9 cells, that also displayed higher APM expression levels compared to TC-1/A9 cells, served as a MHC class I-positive control. *denote significant changes (P<0.05 determined in Student's t-test) as compared to the values for untreated cells. Biological triplicates were used for the analysis. In all experiments, error bars show standard deviations. Relative expression numbers represent the percentage of the β-actin expression levels. The levels of relative gene expression were presented as fold changes compared to the levels found in control samples. Experiments were repeated three times with similar results.
