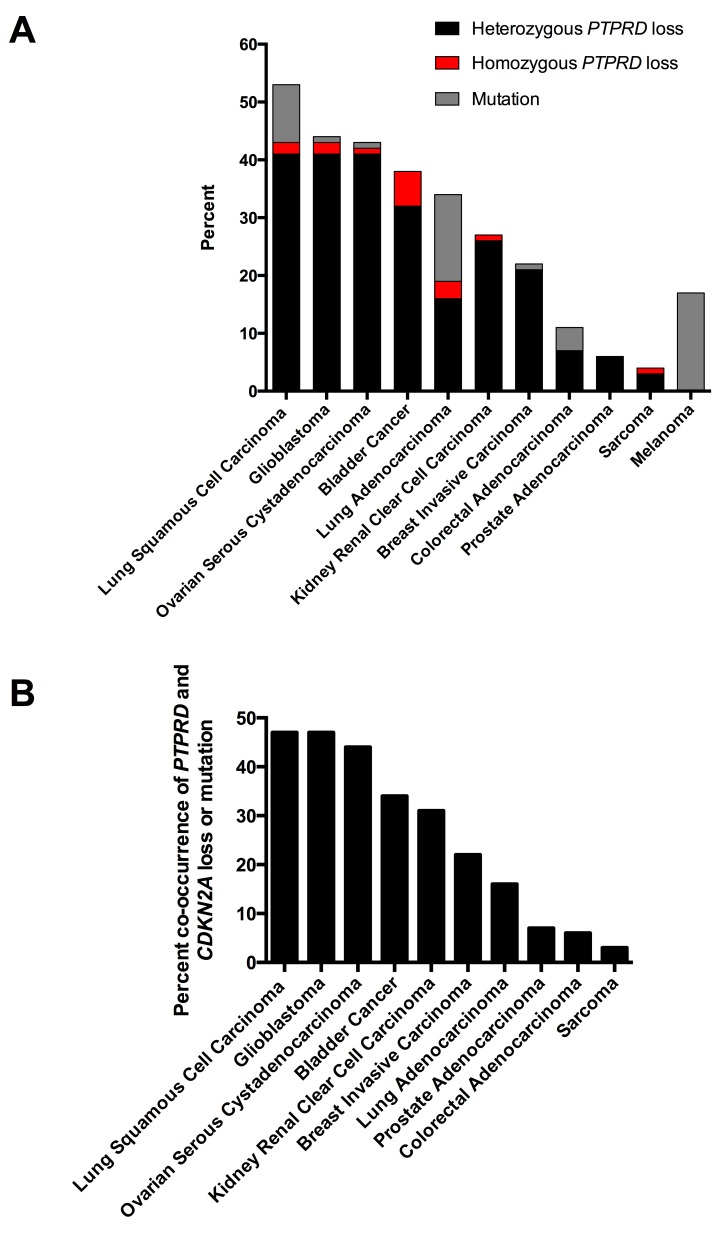
Figure 1. Genetic patterns of PTPRD loss in human cancers.
(A) Histogram of the frequency of mutation and copy number loss of PTPRD in human cancers. Point mutations, heterozygous loss, and homozygous deletions are presented. Data from the cBio Portal. (B) Histogram of the frequency of PTPRD and CDKN2A inactivation (mutation and deletion) in human cancers. Data from the cBio Portal.

