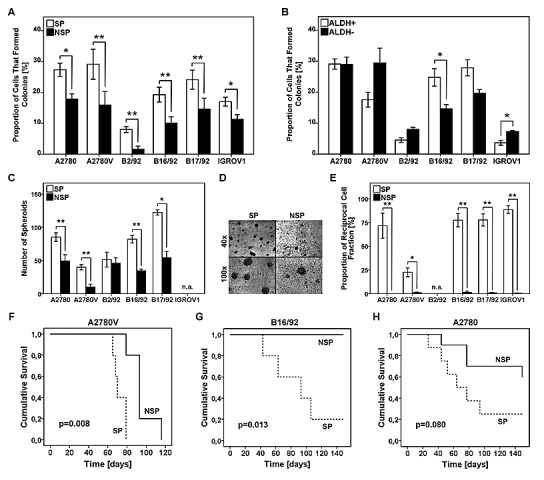
Figure 3. Analysis of SP and ALDH+ cells for functional stem cell characteristics.

(A,B) Analysis of single cell clonogenicity. SP/NSP (A) or ALDH+/ALDH− (B) cells were single cell-sorted and subsequently cultured for two weeks. Wells with outgrowing clones were counted and the proportion of cells capable of colony formation was calculated. (C) Analysis of spheroid formation was performed by seeding 1×10³ SP or NSP cells on primary mesothelial cell monolayers pre-established in 8-well chamber slides, followed by culturing for one week. The number of spheroids per chamber is depicted. (D) Representative photomicrographs of SP and NSP spheroids at the indicated magnifications (cell line: B17/92). (E) Analysis of asymmetric cell division was performed by single cell sorting of SP or NSP cells. After three weeks of culture, viable clones were analyzed for the SP fraction to determine the reciprocal cell population present in the sample. (F-H) Kaplan-Meier survival curves of female NOD/SCID mice. Mice were intra-peritoneally inoculated with 5×10⁴ SP or NSP cells. Tumor development was regularly monitored and mice with severe tumor burden were euthanized. SP, side population; NSP, non-SP; ALDH, aldehyde dehydrogenase; * p<0.05, ** p<0.01; n.a., not applicable.
