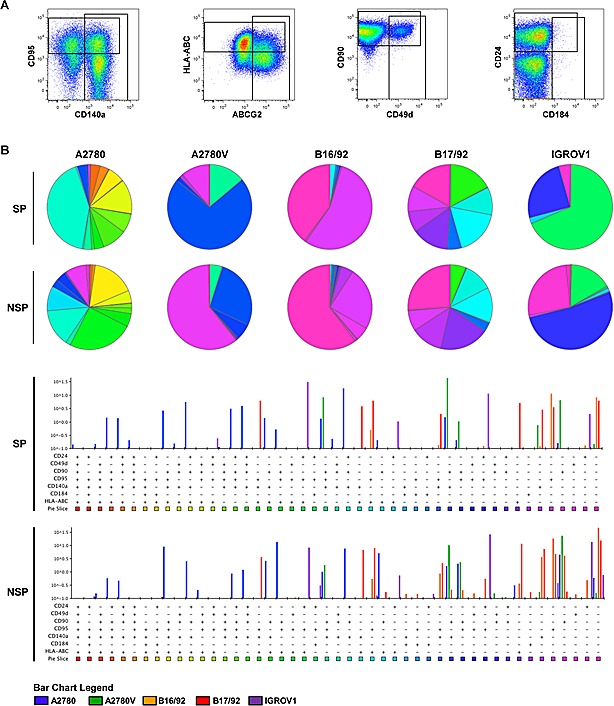
Figure 5. SPICE analysis of ovarian cancer heterogeneity.

Defined mixtures of corresponding SP and NSP fractions were stained for different markers (staining 1 of Suppl. Table 4) and analyzed by multicolor flow cytometry. (A) Definition of populations positive for individual markers (cell line: A2780). These gates were combined by Boolean operations to obtain proportions of cells within all possible combinations, which were then imported into SPICE for final data analysis. (B) SPICE analysis of ovarian cancer heterogeneity after class-division into SP (upper panel) and NSP (lower panel). Subset distributions are presented in the weighted category mode, and only subsets above a threshold of ≥0.1% are shown. Data are representative examples of at least two independent experiments. SP, side population; NSP, non-SP.
