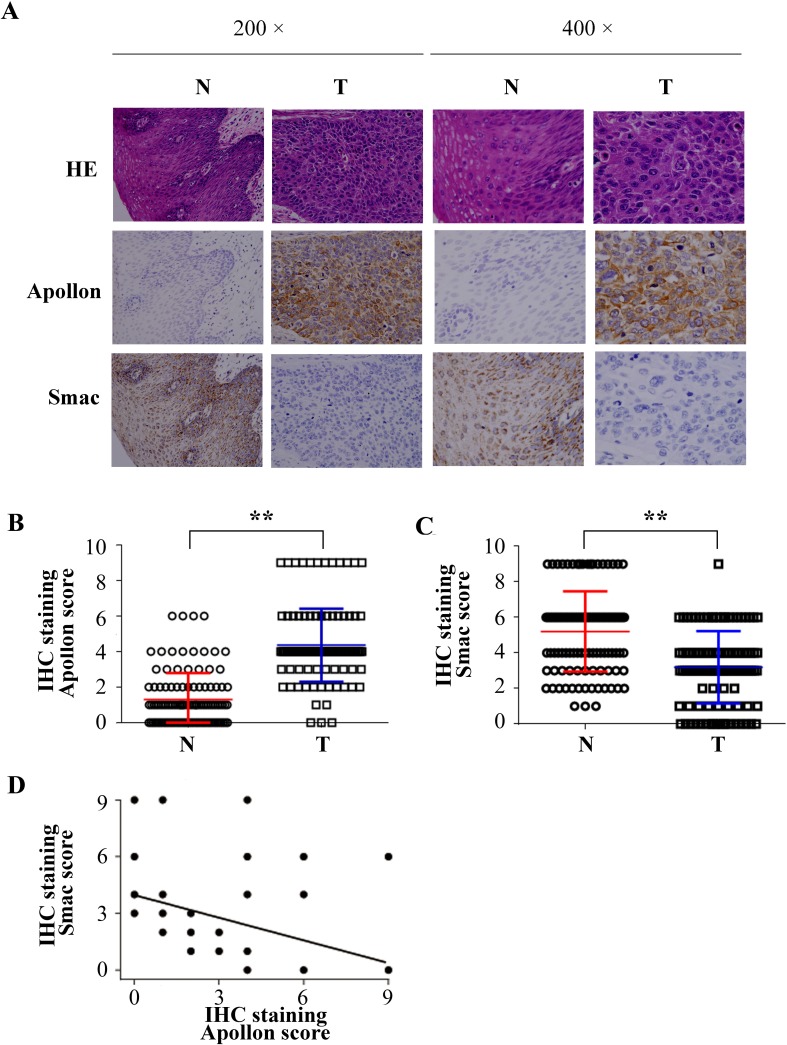
Fig.2. Negative correlation between Apollon expression and Smac expression in clinical ESCC samples.
(A) Typical patterns of Apollon and Smac staining in paired ESCC tissue samples. N, adjacent non-tumorous tissues; T, tumor tissues. Scores of immunochemistry staining of Apollon (B) and Smac (C) in 111 ESCC patients. **P < 0.01. (D) Correlations between Apollon scores and Smac scores in tumor tissues of 111 ESCC patients.

