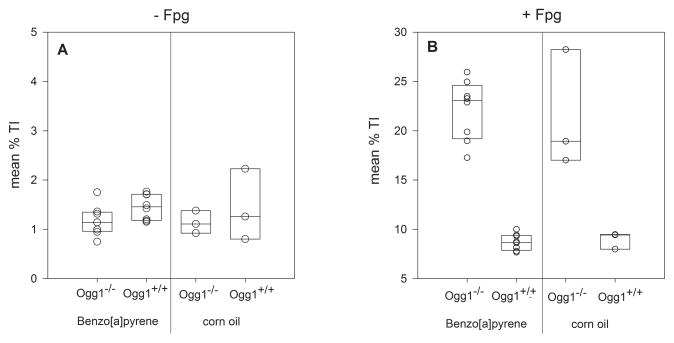
Figure 3. DNA lesions in mouse blood cells measured by the alkaline SCGE without (A) and with Fpg (B) four hours after treatment with BaP.
Each circle represents data for one mouse as mean (n = 8 for BaP, n = 3 for corn oil), based on three technical replicates per mouse. Mouse genotypes and treatments are indicated on the horizontal axis. The box plot shows the median and the first and third quartile.

