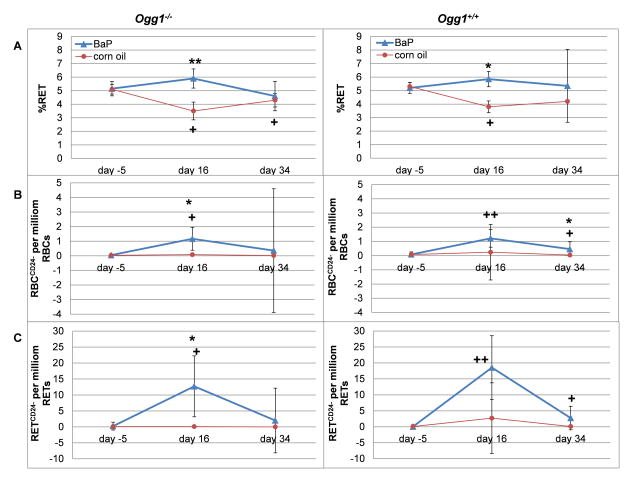
Figure 4. Pig-a mutant frequencies and percent reticulocytes in blood cells of mice treated with BaP.
Data is given as median (SD) for the percentage of reticulocytes (A), and the mutation frequencies of red blood cells (B) and reticulocytes (C). Data was compared to each other by Dunnett’s multiple comparison within a one way ANOVA. Significant differences to the vehicle control (corn oil) of the same genotype and sampling day are indicated by asterisks: p ≤ 0.05 (*) and p ≤ 0.001 (**). Significant differences between day 16 and day 34, respectively, to day −5 are marked with crosses: p ≤ 0.05 (+) and p ≤ 0.001 (++).

