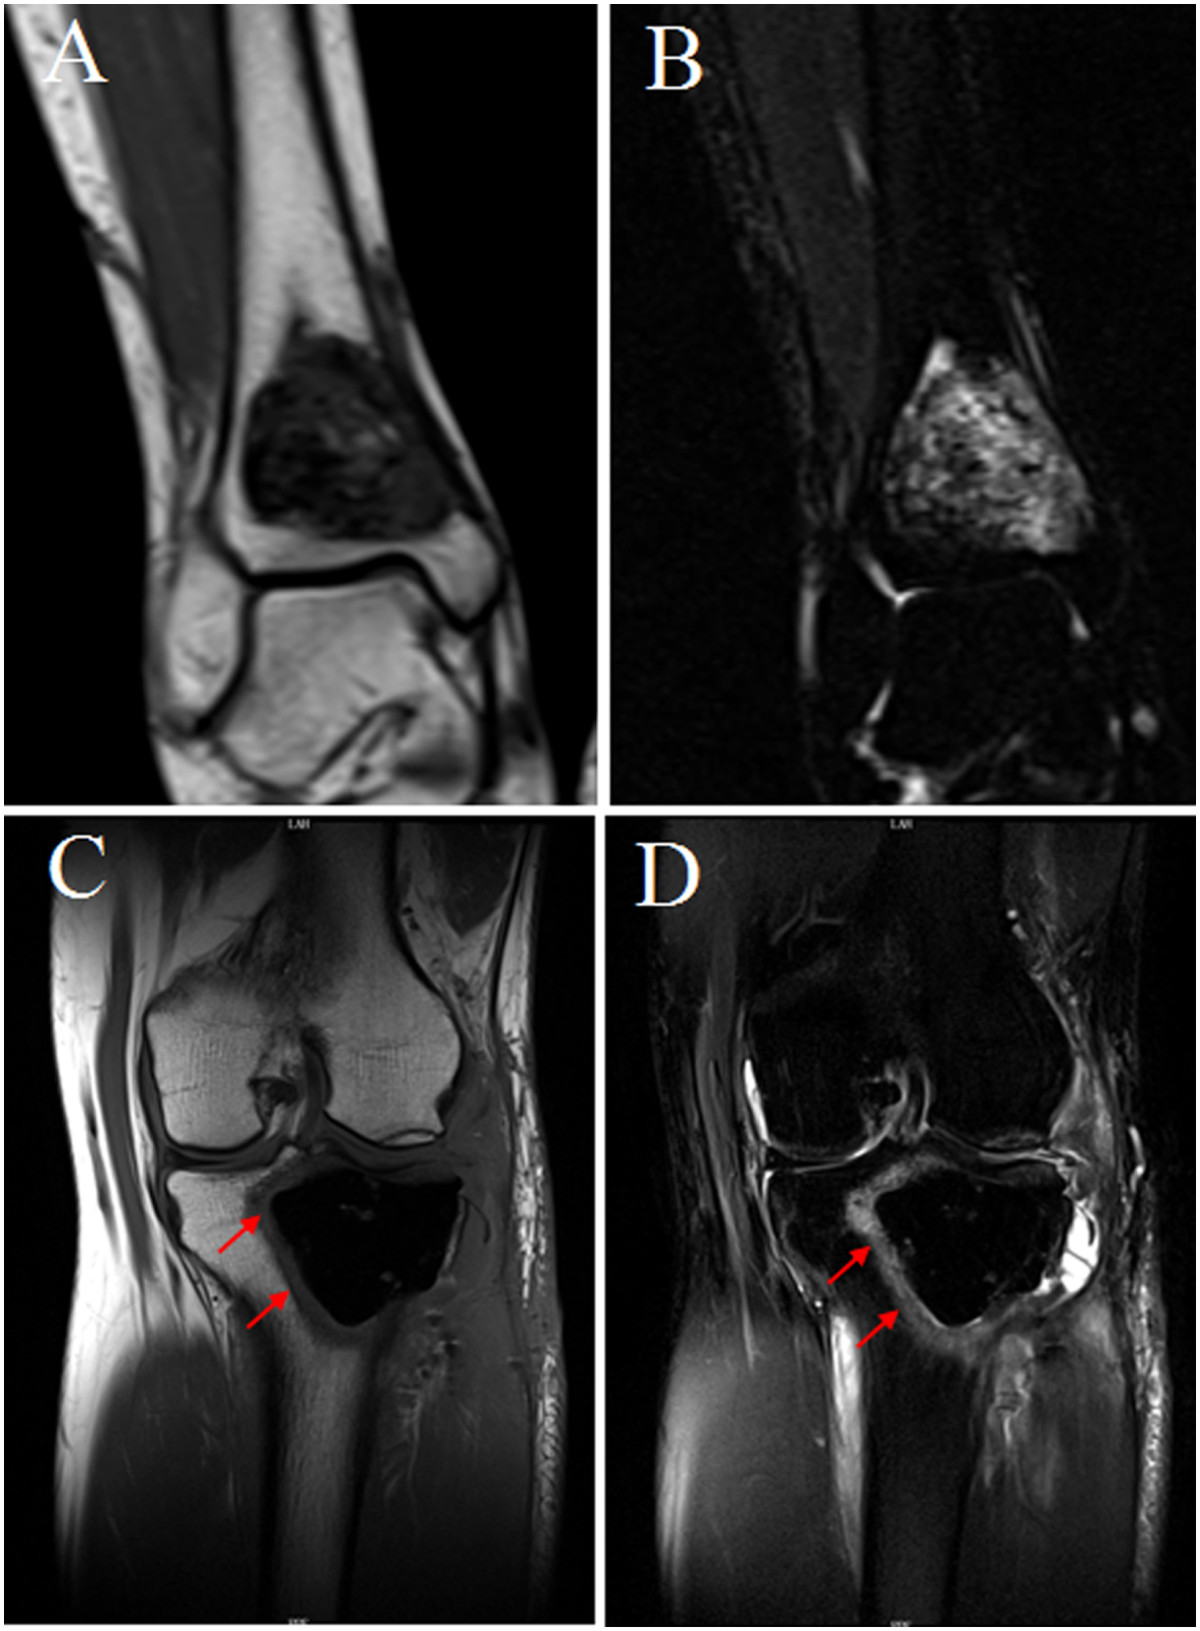
Figure 4.

Different MRI findings between bone grafts and bone cement group after agreessive curettage during follow up. The coronal T1WI (A) and coronal fat-suppressed T2WI (B) showed that the band signal around the area filled with bone cement. No similar MRI findings in the bone grafting group (C and D).
