Figure 1.
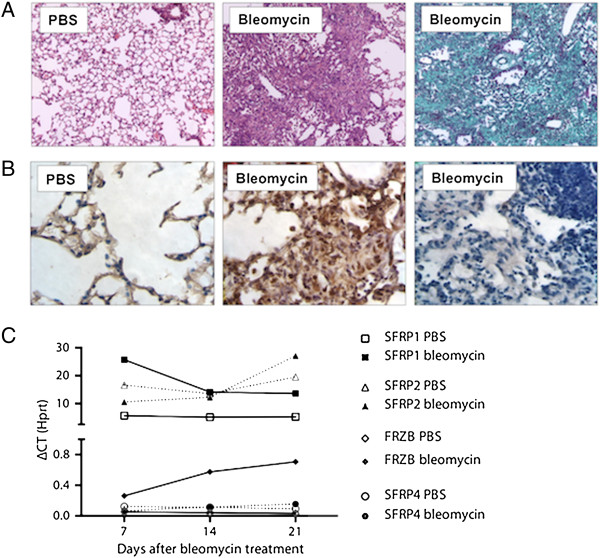
WNT and SFRP dynamics in bleomycin-induced lung fibrosis. (A) Representative images lungs from WT mice, 4 weeks after PBS or bleomycin instillation. (Hematoxylin-Eosin and Masson Trichrome staining) (B) β–catenin or goat IgG (negative control, 3rd panel) immunohistochemistry, 4 weeks after intratracheal PBS or bleomycin instillation in WT mice. (C) Total lung gene expression level of Sfrp1, Sfrp2, Frzb and Sfrp4 following bleomycin instillation (n = 4, except for bleomycin group at day 21 n = 2; data presented as mean and SEM of ΔCT values normalized to Hprt expression).

