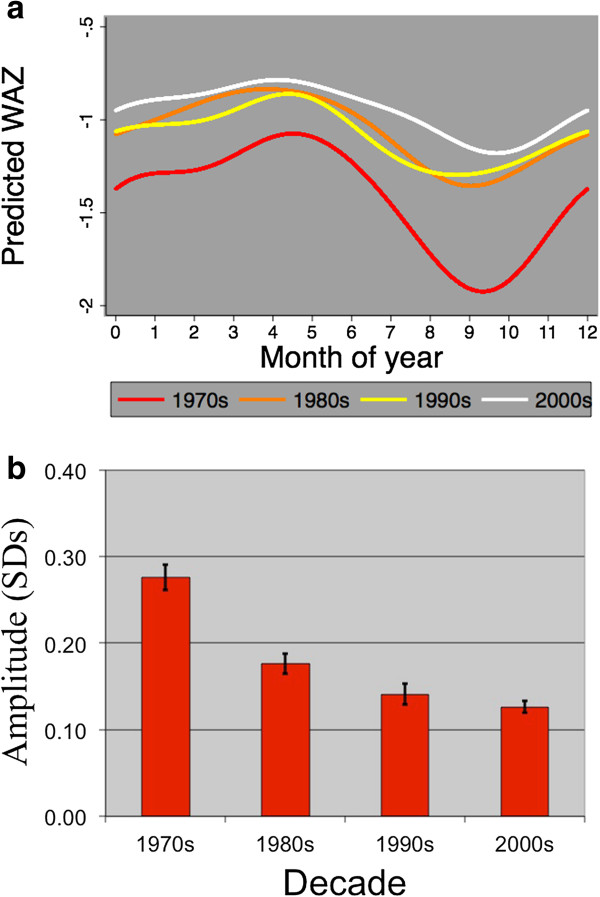
Figure 1.
Declining seasonality of weight-for-age Z-scores (WAZ). (a) Seasonal patterns for each decade. (b) Estimated amplitude vs decade. Predicted WAZ for under-2 year old children in Keneba, Kiang West, The Gambia. These data were derived from approximately 10,000 observations on 800 individuals (boys and girls combined; their pattern were very similar) each decade. The first three pairs of Fourier terms were used to fit the curves for each decade. The z-scores were based on the WHO 2006 standard tables.

