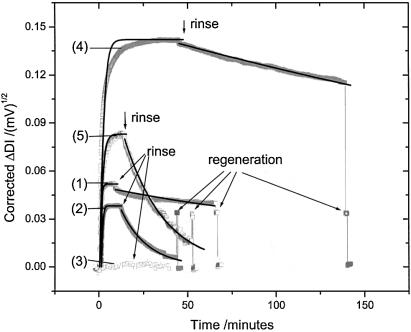
Figure 3.
Kinetic curves of hybridization (from 1 µM solutions) of different targets, i.e. T15-0 (curve 1), T15-1 (curve 2), T15-2 (curve 3), T75-0 (curve 4), T75-1 (curve 5) to the probe surface. The signals are corrected according to the quadratic dependence of DI on the optical contrast (cf. text). A 1 min pulse injection of 10 mM NaOH solution was used to regenerate the probe surface with ∼100% recovery. Signal exponential fits derived from a 1:1 Langmuir model were applied to derive the association/dissociation phases of the binding curves. The corresponding kinetic constants obtained were used for the KA calculations.

