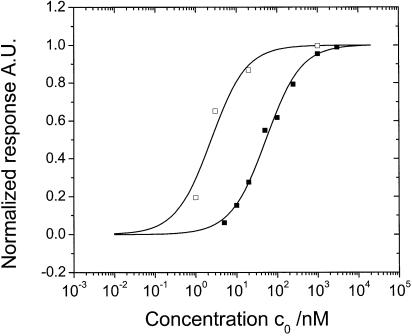
Figure 4.
Stepwise titration of the 15mer target [T15-0 (hollow square) and T15-1 (filled square), respectively] solutions with increasing concentration in the circulation loop connected to the flow cell. Each concentration was applied until equilibrium was attained. The equilibrium signals are normalized to the saturation responses (corresponding to a target surface concentration of ∼2.4 × 10¹² and ∼1.8 × 10¹² molecules/cm2 for the T15-0 and T15-1 targets, respectively) of the corresponding target at its maximum concentration. Langmuir fits (solid lines) to the isotherms yield the affinity constants, KA = 4.17 × 10⁸ M–1 and KA = 1.92 × 10⁷ M–1 for T15-0 and T15-1, respectively.

