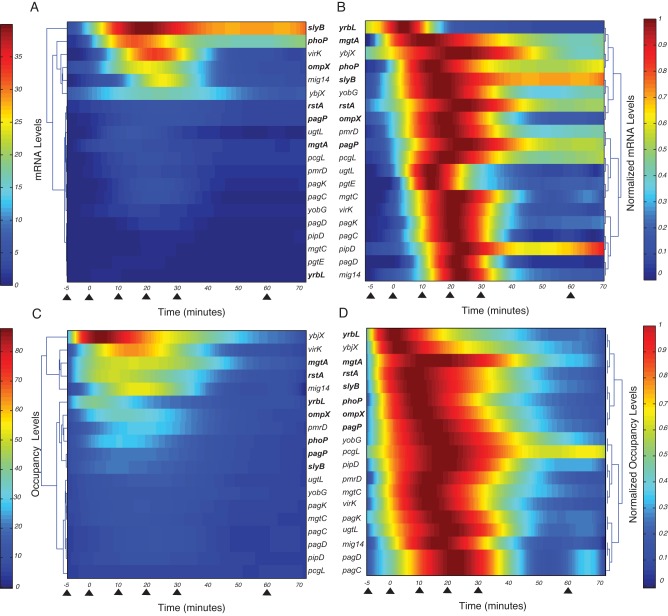
FIG 1 .
mRNA levels of PhoP-activated genes and occupancy by PhoP-P of the corresponding promoters. Ancestral genes are indicated in boldface. (A) Clustering of the mRNA levels for PhoP-dependent genes harvested at 0, 5, 10, 20, 30, 60, and 90 min (triangles) after Salmonella (EG13918) was shifted from medium containing repressing (10 mM) to activating (50 µM) Mg2+ concentrations (triangles; only the first 70 min are shown). The data were smoothed by polynomial interpolation and clustered (see Materials and Methods). The range of mRNA levels is illustrated by the color bar. (B) Clustering of the mRNA levels obtained in panel A normalized to the maximum values for each gene. Grouping was performed by emphasizing the first 40 min to uncover clusters based on the mRNAs onset times (51). (C) Clustering of the in vivo promoter occupancy by the PhoP-P protein determined by ChIP assays using Salmonella (EG13918) grown in 10 mM Mg2+ and then switched to 50 µM Mg2+ and harvested at 0, 5, 10, 20, 30, 60, and 90 min (triangles, only the first 70 min are shown). Bacterial growth, data preprocessing, and clustering were performed as described for panel A. (D) Clustering of the normalized promoter occupancy by the PhoP protein corresponding to the data presented in panel C.

